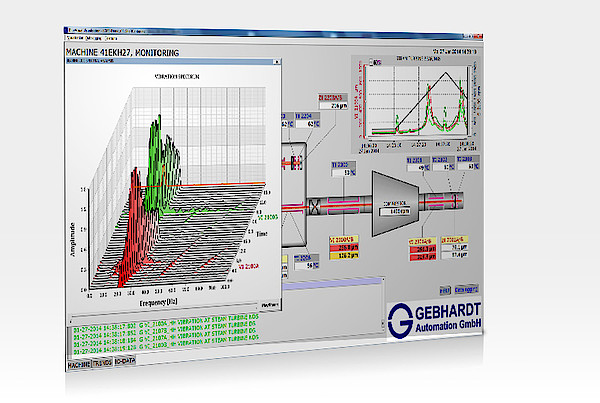
GA BlueVisual is a local process visualization that supports—in addition to other capabilities of GA TurWin—also the basic functions of machine monitoring (MMS – Machinery Monitoring System or CMS – Condition Monitoring System). The high-resolution vibration monitoring data can be recorded and visualized for this purpose.
The display supports frequency spectra, orbits, PT and PV diagrams, and also visualization as high-resolution trends, synchronous or asynchronous). Orbits and frequency spectra in the form of waterfall diagrams can provide a good insight into changes over time.